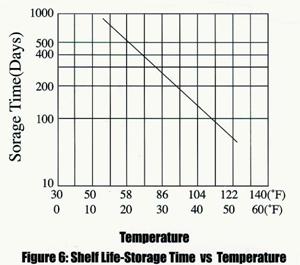
Shelf –storage Time VS. Temperature Figure 6 shows the time for the capacity to decrease to 50% of nominal capacity at each temperature during storage. If the storage temperature is known, The diagram may be used for finding the most useful recommended refresh charge intervals.